
Fluorescent Protein Libraries
(Pooled Library #245482, #245483)
-
Purpose
The Fluorescent Protein Libraries were generated by DropSynth multiplex gene synthesis. Each pooled library contains many hundreds of thousands of individual plasmid molecules spanning both intended full-length designs (perfects) and a spectrum of assembly mutants. Originally ~620 fluorescent protein sequences were targeted. For each target fluorescent protein, two different synonymous DNA sequences that encode the same amino acid sequence (two codon-optimized versions, C1P and C2P), were designed to reduce sequence-specific bias during synthesis and assembly. A protein was counted as covered if at least one of its codon versions was recovered as a perfect amino-acid sequence in either library. The libraries contain two codon-optimized versions of over 580 known beta barrel fluorescent proteins (FPs) from FPbase. The libraries enable researchers to explore a broad range of spectral properties and applications. The collection is ideal for benchmarking protein expression, developing imaging tools, or serving as a starting point for fluorescent protein engineering.
-
Vector Backbone
-
Depositing Labs
Ordering
| Item | Catalog # | Description | Quantity | Price (USD) | |||
|---|---|---|---|---|---|---|---|
| Pooled Library | 245482 | FP Library (codon1 – C1P) | 1 | $473 | Add to Cart | ||
| Pooled Library | 245483 | FP Library (codon2 – C2P) | 1 | $473 | Add to Cart | ||
Library Details
-
SpeciesThe inserts are derived from a broad range of species, including Aequorea victoria and other marine organisms (e.g., corals, sea anemones, and jellyfish), representing known beta-barrel fluorescent proteins from diverse taxa. All sequences have been codon-optimized for expression in E. coli.
-
Inserts1,035 unique genes (544 of one codon version (C1P) and 491 of another codon version (C2P)) corresponding to 583 unique proteins, plus additional mutants. The counts of 544 and 491 refer specifically to the number of intended, full-length DNA designs that were recovered perfectly in each codon library after sequencing and consensus calling. Mutants are not included in the 1,035 unique genes count. They refer to the expected spectrum of synonymous, non-synonymous, and frameshift variants generated during pooled synthesis and are quantified separately in Figure 2C.
-
Size of insertsGenerally 642 bp to 804 bp (214 aa to 268 aa)
Library Shipping
Each library is delivered in a microcentrifuge tube on blue ice. The tube's contents will not necessarily be frozen. For best results, minimize freeze/thaws.
-
Volume∼15 µL
-
Concentration50 ng/µL
Resource Information
-
Protocols
- Library Amplification Protocol (DOCX, 2.5 MB)
- Dial-Out PCR Protocol (DOCX, 2.8 MB) for how individual genes can be recovered from the library
- NGS Sequencing Protocol (DOCX, 2.5 MB) for primers and protocols
-
Depositor Data
-
The raw PacBio data is available here:
- C1P (Parents Codon 1): SRA accession SRX29434776 (Link opens in a new window)
- C2P (Parents Codon 2): SRA accession SRX29434777 (Link opens in a new window)
- Mapping data is available at https://doi.org/10.6084/m9.figshare.30585419 (Link opens in a new window) and additional information is available in Mapping Data Information (DOCX, 15 KB)
-
The raw PacBio data is available here:
-
Scripts
- The depositing lab recommends using the Fluorescent Protein NGS pipeline (Link opens in a new window) for full NGS analysis.
-
Terms and Licenses
Academic/Nonprofit Terms- UBMTA
- Evrogen Limited Use Label License for FPs
- mNeonGreen Label License
- Takara FP (formerly Clontech)
Industry Terms- Not Available to Industry
Trademarks- Zeocin® is an InvivoGen trademark.
Depositor Comments
Circular consensus sequencing (CCS) reads were demultiplexed with Lima. A custom python script was used to first identify the constant regions flanking the barcode (TGGCTGCGGAAC-20N-GCACGACGTCAG) allowing up to 3 mismatches. The variable region was extracted from each read by scanning for the presence of the NdeI (CATATG) site at the start codon and an end motif (TAAGGTACCTAAGTG) with a stop codon, KpnI cloning site, and some conserved sequence. Barcode counts were collapsed in starcode (1.4) with a distance of 1 using the sphere algorithm. A consensus call was made for each barcode using a simple majority call. All subsequent analysis and plotting was carried out in R.
General statistics for the libraries are shown in the figures.
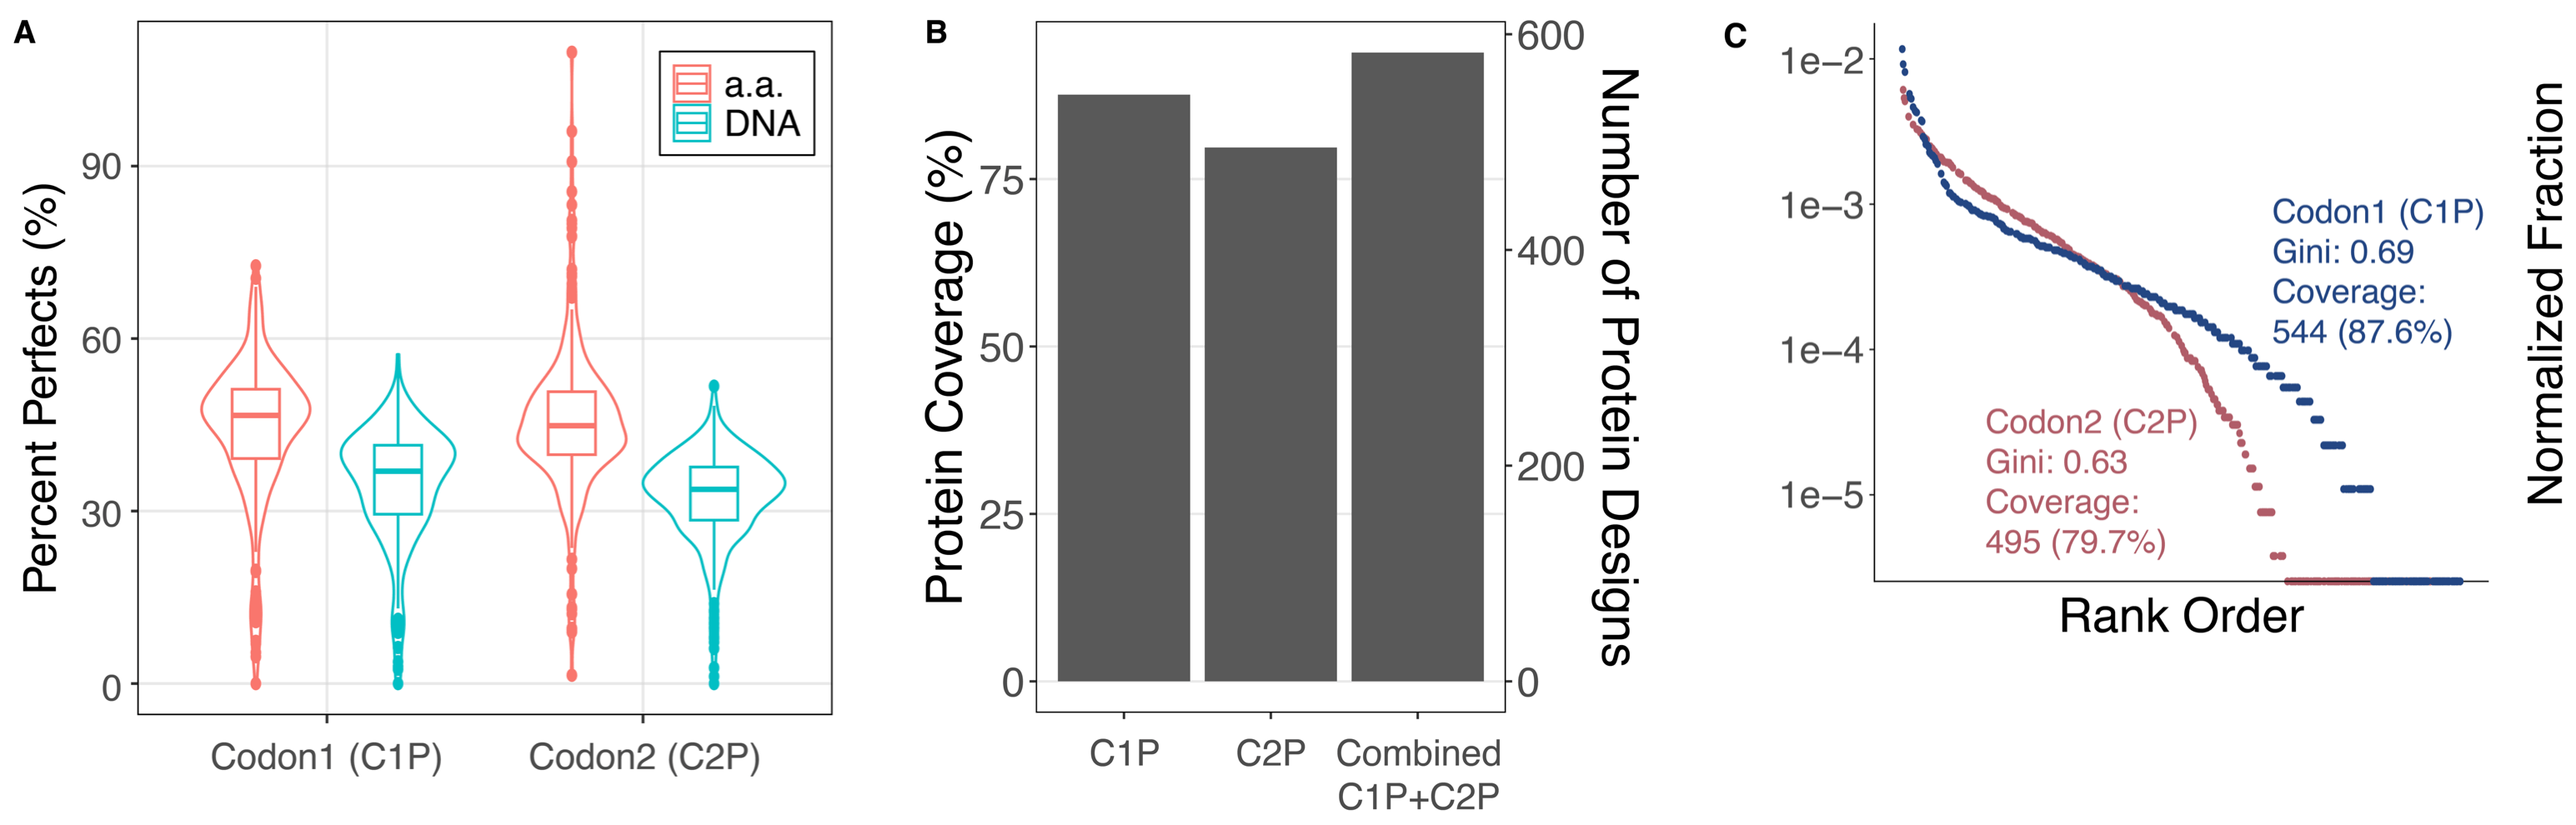
Figure 1: (A) The distribution of designed genes that perfectly matched at the DNA and amino acid level (including synonymous mutants). Data is generated at the barcode level for genes with at least 100 barcodes observed. (B) The coverage of each library (87.6%, 79.7%) and combined over the two (93.9%). Genes are included if they are observed at least once with a perfect amino acid sequence. (C) A rank order plot showing the uniformity of representation in each gene library.
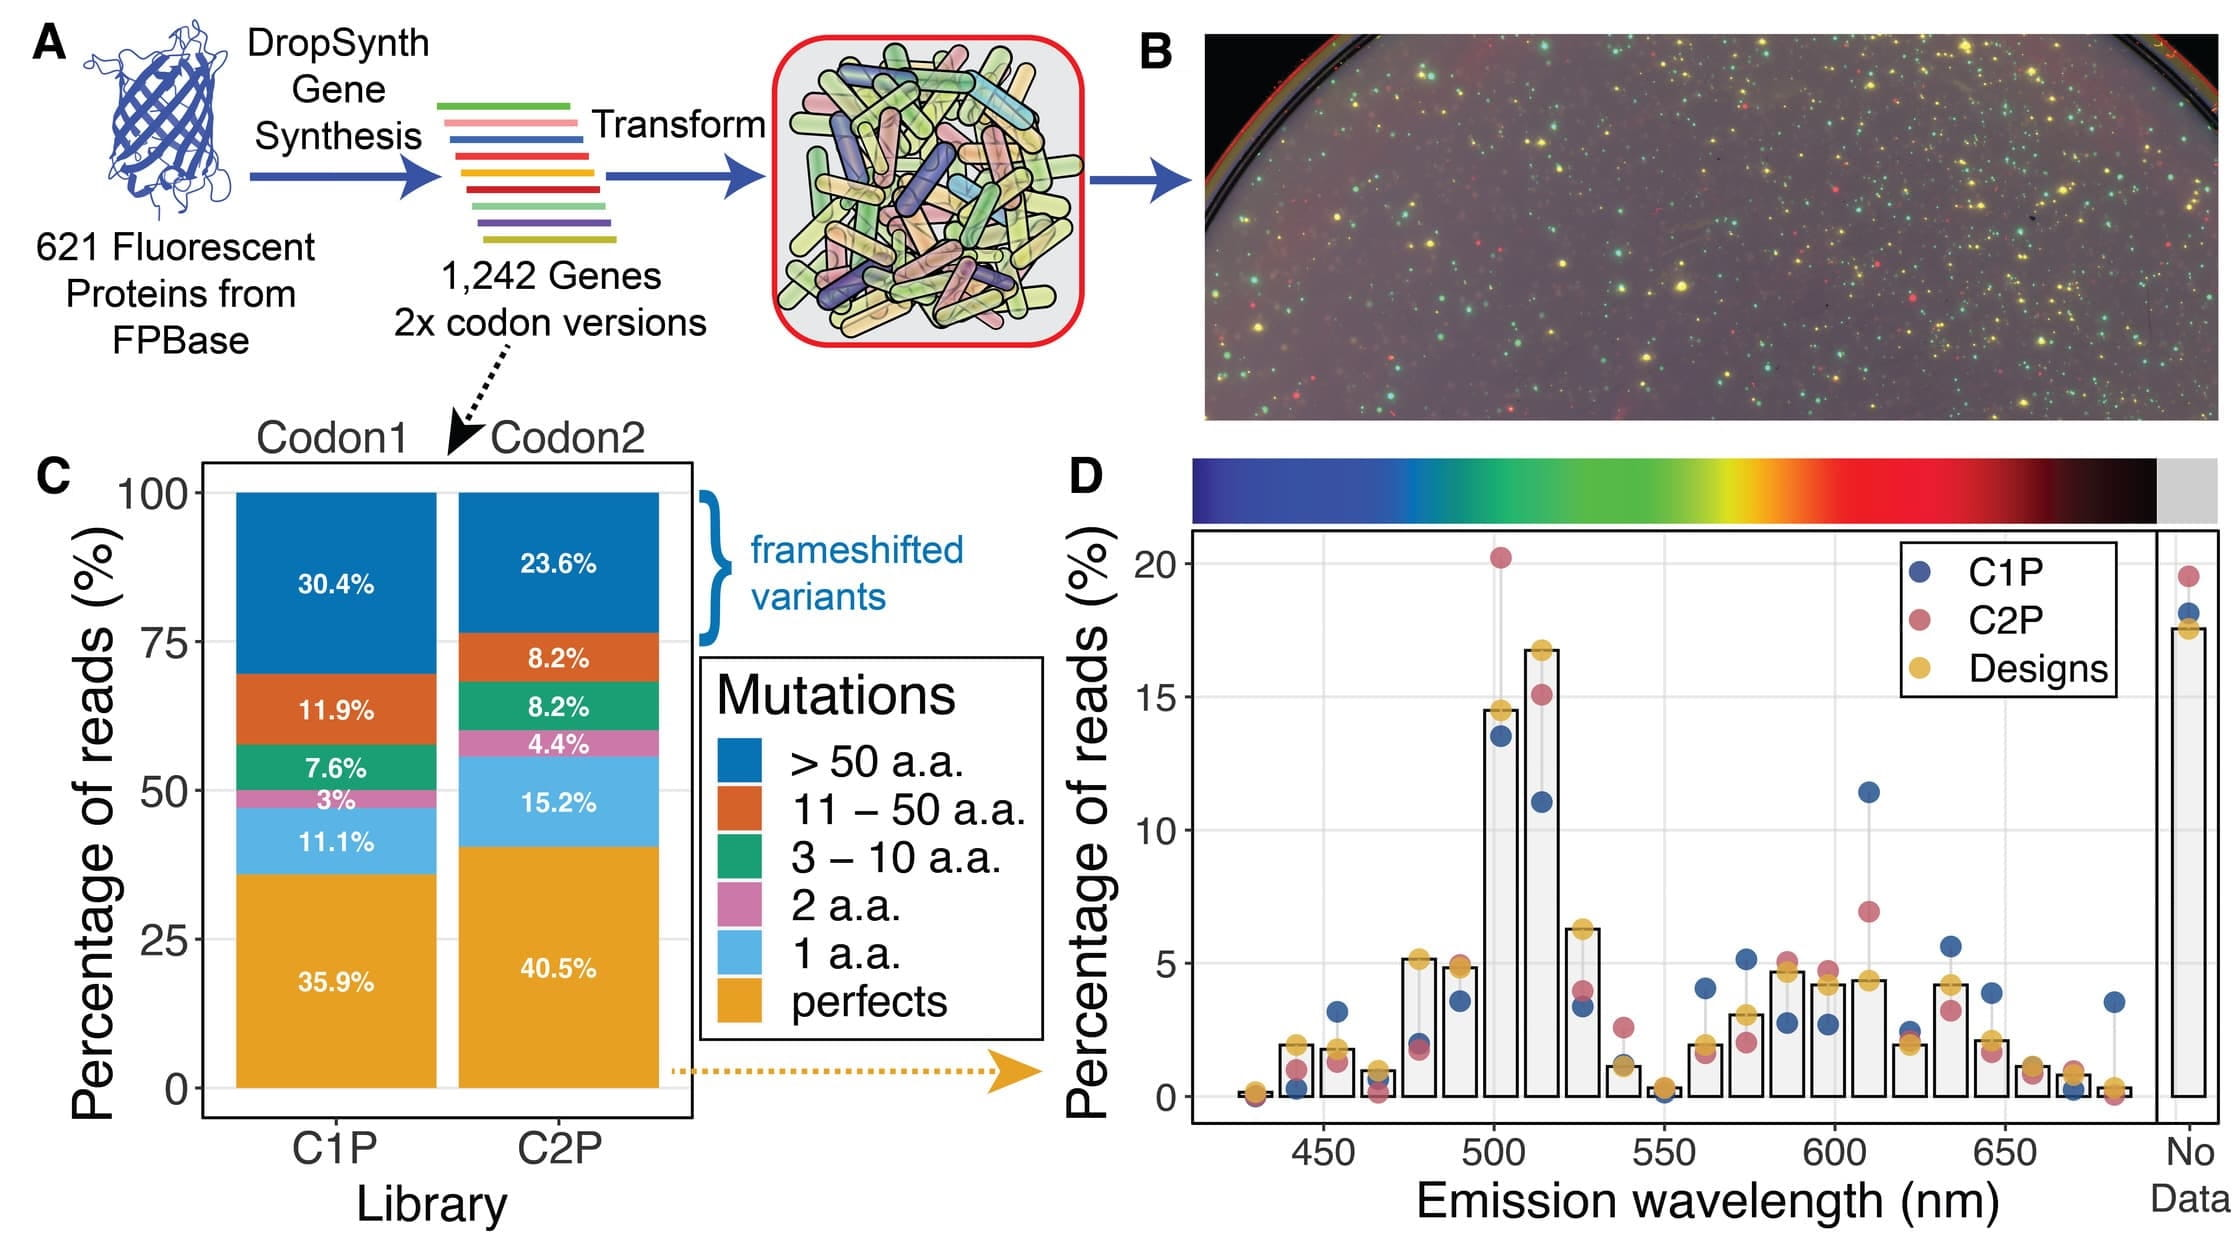
Figure 2: DropSynth Assembly of Fluorescent Protein Libraries. (A) Schematic overview of the approach. A set of 621 fluorescent proteins was synthesized as two different codon gene libraries. (B) False-color overlay of Typhoon laser scanner images show many colonies with functional fluorescent proteins recorded at four different emission wavelength ranges (Excitation (Ex): 488 nm, Emmission (Em): 515–535 nm and 560–580 nm; Ex: 532 nm, Em: 560–580 nm; Ex: 635 nm, Em: 655–685 nm). (C) The distribution of mutants in each parent library (C1P and C2P). At least 35% of reads in each library perfectly matched the amino acid sequence of the predicted protein. Over one fifth of the libraries are mutants within 10 aa of the designed sequence while at least one fourth are low-value frameshifted variants. (D) The percentage of reads mapped by proteins' emission wavelengths (as listed by FPbase) relative to the designed distribution (based on perfect sequences only).
The backbone is the same as pEVBC1_moxBFP (Plasmid #248345) except that the genes are cloned between NdeI and KpnI and the barcode region is a 20 bp random sequence flanked by: TGGCTGCGGAACNNNNNNNNNNNNNNNNNNNNGCACGACGTCAG. Plasmid pEVBC1_moxBFP can be used as a control with the library.
Please visit https://doi.org/10.64898/2026.03.01.706892 (Link opens in a new window)for bioRxiv preprint.
These pooled libraries were created by your colleagues. Please acknowledge the Principal Investigator, cite the article in which the plasmids were described, and include Addgene in the Materials and Methods of your future publications.
-
For your Materials & Methods section:
The Fluorescent Protein Library (codon1 – C1P) was a gift from Calin Plesa (Addgene #245482; http://n2t.net/addgene:245482 ; RRID:Addgene_245482)
The Fluorescent Protein Library (codon2 – C2P) was a gift from Calin Plesa (Addgene #245483; http://n2t.net/addgene:245483 ; RRID:Addgene_245483) -
For your References section:
High Diversity Gene Libraries Facilitate Machine Learning Guided Exploration of Fluorescent Protein Sequence Space. Benabbas A, Kearns P, Billo A, Chisholm LO, Plesa C. bioRxiv 2026.03.01.706892. doi: 10.64898/2026.03.01.706892